Best Free Tools for Making Scientific Figures (2026)
Free tools for scientific figures compared: Sciicons, LabCanvas, Inkscape, Affinity, matplotlib, ggplot2 and open icon libraries, with licences checked.
Last updated: October 11, 2026. Prices and plan limits change often; every claim below links to the source we checked on that date.
Quick answer: The best free tools for scientific figures in 2026 are Sciicons for free SVG illustrations, Inkscape or Affinity for layout, matplotlib or ggplot2 for plots, and openly licensed libraries such as Servier Medical Art and NIH BioArt. Free tiers of BioRender and Mind the Graph lack publication rights or keep watermarks.
What is the best free workflow for scientific figures?
For most researchers, a strong free figure workflow is:
- Plot data in code with matplotlib (Python) or ggplot2 (R), exported as SVG or PDF.
- Assemble and annotate in a free vector editor: Inkscape (open source, GPL) or Affinity, which Canva made free for everyone in 2025.
- Add illustrations from openly licensed libraries such as Servier Medical Art (CC BY 4.0), NIH BioArt (public domain or CC BY per item), Bioicons (license per icon), SciDraw (CC BY 4.0 or CC0), or Sciicons (free SVG library, with optional Pro packs).
If you need a drag-and-drop science illustrator with a large icon catalogue, note that the free tiers of the best-known ones (BioRender, Mind the Graph) do not include publication rights or remove watermarks. Details are in the tables below.
Which all-in-one figure tools should you try first?
Sciicons
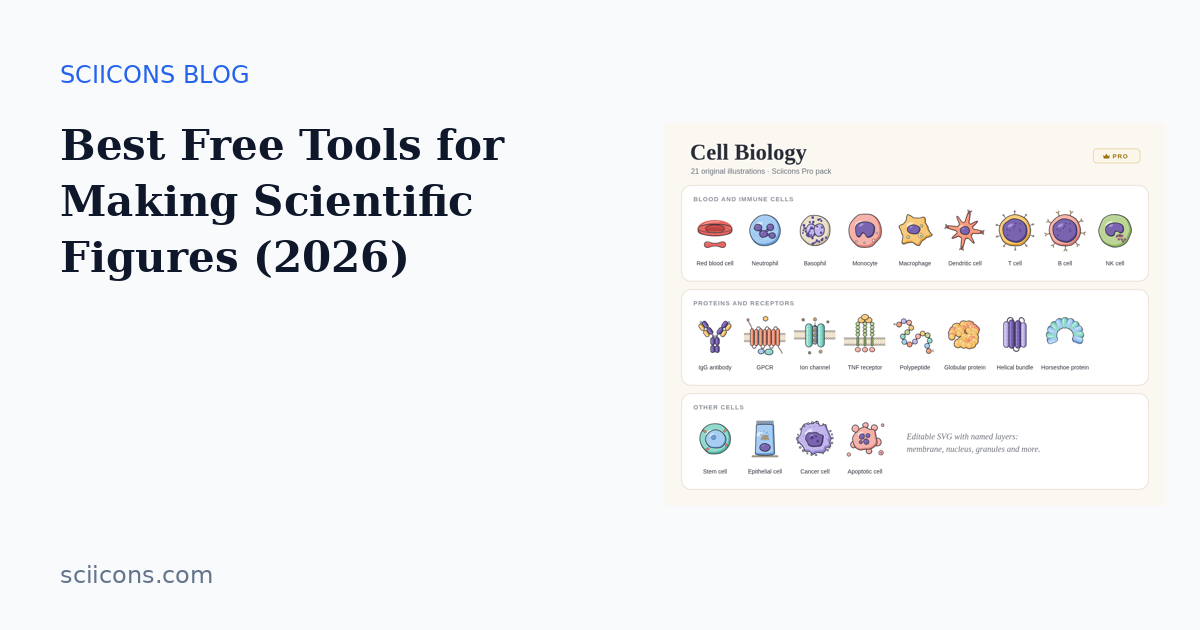
Sciicons is a free, searchable library of about 4,900 scientific SVG icons and illustrations (cells, microbiology, anatomy, chemistry, lab equipment and more). Each icon page shows its licence and credit line, icons can be copied as SVG or recoloured in the browser, and optional Pro packs add detailed original sets such as Cell Organelles and Assays. Sciicons also includes browser tools: Molecules (2D/3D structures from PubChem), Proteins (PDB ribbons and surfaces), the Gel Builder and the Well Plate Colorer; previews are free and their SVG/PNG downloads are part of Pro.
LabCanvas
LabCanvas is a browser-based scientific design platform with a 2D canvas, scientific icon packs, 3D generators, a protein visualizer, a molecule editor, an optics table and a chart editor, exporting SVG and PNG. You can get started free. The separate LabCanvas Blender addon (one-time purchase, Blender 4.2+) adds generators for molecules, crystals, DNA, neurons, membranes and devices for rendered 3D figures.
MolDraw
MolDraw is a free online chemical drawing tool with a 2D editor, reaction drawer, SMILES input, 3D viewer and image export, useful for the chemistry panels of a figure.
How did we compare the tools?
We looked at what matters when a figure is going into a paper, poster or thesis:
- Cost of the free tier and what it actually allows.
- License for publication: can you put the result in a journal article?
- Output format: vector (SVG/PDF/EPS) versus raster only.
- Learning curve for a busy researcher.
We did not test every feature in depth; where a detail comes only from a third-party source or could not be confirmed, it is marked (unverified).
Which free figure tools are best? Comparison table
| Tool | Type | Free tier | Publication use on free tier | Vector export | Source |
|---|---|---|---|---|---|
| Inkscape | Vector editor | Fully free, open source (GPL) | Yes, you own your work | SVG, PDF, EPS | inkscape.org license |
| Affinity (by Canva) | Vector, pixel and layout editor | Free with a Canva account | Yes (your own artwork) | Yes | Canva Help |
| matplotlib | Python plotting library | Free, open source | Yes | SVG, PDF, EPS | matplotlib.org |
| ggplot2 | R plotting package | Free, open source | Yes | SVG, PDF via R devices | ggplot2 |
| Servier Medical Art | Medical/biology image library | Free | Yes, under CC BY 4.0 with credit | Images and PowerPoint kits | SMART terms |
| NIH BioArt | Biomedical illustration library | Free | Yes; public domain or CC BY per item | Many items as vector | BioArt terms |
| Bioicons | Open science icon library | Free | Depends on each icon's license (CC0, MIT, CC BY, CC BY-SA, BSD) | SVG | Bioicons GitHub |
| SciDraw | Neuroscience/biology drawings | Free | Yes, CC BY 4.0 or CC0 per drawing | SVG and others | SciDraw licensing |
| Sciicons | Scientific SVG icon and illustration library | Free library; optional Pro packs | Yes; license shown on each icon (often CC0, some CC BY) | SVG | sciicons.com/cite |
| BioRender (Basic) | Online science illustrator | Free Basic plan | No: no publication or commercial use; watermark | Paid plans only for high-res, no watermark | BioRender pricing |
| Mind the Graph (Starter) | Online science illustrator | Free Starter plan | Exports keep a watermark; citation of the platform required | Paid plans remove watermark | Mind the Graph FAQ |
Which free vector editor should you use?
A vector editor is the workbench for multi-panel figures: you arrange plots, add arrows and labels, align panels and set fonts consistently.
Inkscape
Inkscape is free and open-source software released under the GNU General Public License (license page). It edits SVG natively and exports PDF and EPS, which most journals accept.
Good for: multi-panel layout, editing SVG plots from matplotlib or ggplot2, recoloring icons, and producing vector graphical abstracts.
Watch out for: a steeper learning curve than slide software, and occasional font handling quirks when sharing files across computers. Embed or convert text to paths before final export if a journal requests it.
Affinity (by Canva)
In 2025 Canva relaunched Affinity as a single free application with vector, pixel and layout tools; it needs a free Canva account to activate (Canva Help, Canva newsroom). Some AI features require a paid Canva plan.
Good for: researchers who want a polished, Illustrator-like interface at no cost, on macOS or Windows.
Watch out for: it requires an account sign-in, and Linux is not listed on the download page (affinity.studio/download).
For comparison: Adobe Illustrator
Illustrator is the industry standard but has no free tier, only a trial. Adobe lists current prices on its pricing page; third-party reviews report about US$22.99/month on an annual plan in 2026 (check Adobe's page for your region; prices vary). Many universities provide Creative Cloud through institutional licenses, so check with your IT department first.
Which plotting tools keep data figures editable?
matplotlib (Python)
matplotlib is the most widely used Python plotting library. Saving with plt.savefig("figure.svg") or .pdf keeps text and lines as vectors you can refine in Inkscape or Affinity.
ggplot2 (R)
ggplot2 implements the grammar of graphics in R. Use ggsave("figure.pdf") or an SVG device to keep output editable.
Tips for publication-ready plots
- Set the final figure width in your code (for example single-column or double-column width from the journal's author guide) so fonts don't shrink when scaled.
- Use colorblind-safe palettes such as viridis for continuous data.
- Export vector first; rasterize only at the end if the journal requires TIFF.
Where can you get free scientific illustrations?
Schematic panels (cells, organs, lab equipment, pathways) are where most researchers lose time. Free libraries help, but licenses differ and that matters for publication.
Servier Medical Art (SMART)
Servier's library of medical and biological images is licensed under CC BY 4.0: you may share, adapt and use the images commercially if you credit Servier, link to the license and indicate changes (terms of use, how to cite).
NIH BioArt
NIAID's BioArt Source offers biomedical illustrations for educational, research and commercial use. Items marked Public Domain need no citation, while items marked CC BY require attribution (BioArt FAQs, terms).
Bioicons
Bioicons is an open-source collection of science icons; each icon carries its own license, commonly CC0, MIT, CC BY, CC BY-SA or BSD (GitHub). Check the license per icon before publishing.
SciDraw
SciDraw hosts free scientific drawings (strong in neuroscience and animal models) under CC BY 4.0 or CC0, depending on the drawing (licensing).
Sciicons
Sciicons is a free, searchable library of scientific SVG icons and illustrations, roughly 4,900 at the time of writing, from several open collections plus original drawings. It covers cell biology, microbiology, anatomy, chemistry and lab equipment. Each icon page shows its license (many CC0, some CC BY or CC BY-SA with the required credit text), and icons can be copied as SVG or downloaded without signing in. Optional paid Pro packs add detailed original illustration sets (for example cell organelles or assays).
Are free tiers of online illustrators enough for papers?
Drag-and-drop science illustrators are fast, but read the license on the free tier before you build a paper figure in one.
| Service | Free tier | Publication rights on free tier | Entry paid price (as listed) | Source |
|---|---|---|---|---|
| BioRender | Basic: $0, 1 graphing file, watermark | No; no publication or commercial use | Academic Individual: $39/month or $420/year | Pricing, Academic Individual |
| Mind the Graph | Starter: free, limited library | Watermark must remain; cite the platform | Researcher plan reported at $15/month (verify on pricing page) | Free-use FAQ |
BioRender states plainly that "figures made on the free plan" cannot be used for publications or commercial use (pricing FAQ). BioRender's help center also notes that the free Basic plan or trial may be used for theses uploaded to university repositories, but journal publication requires an academic license (licensing article).
How do you make a scientific figure for free, step by step?
- Sketch the story on paper: one message per panel.
- Generate data panels in matplotlib or ggplot2 at final size; export SVG/PDF.
- Collect schematic elements from CC0 or CC BY libraries; keep a credits list as you go.
- Assemble in Inkscape or Affinity, aligning panels on a grid and using one font family.
- Check accessibility: colorblind-safe palette, text at least 6–8 pt at final size (follow your journal's guide).
- Add credits for CC BY assets in the legend or acknowledgments.
- Export in the format the journal asks for, keeping a layered vector master.
Which tool is right for your situation?
- No budget, needs publication rights: Inkscape or Affinity + openly licensed icons.
- Heavy data visualization: matplotlib or ggplot2, then a vector editor for layout.
- Lab with funding and many schematics: a paid illustrator plan may save time; compare license terms carefully.
- Teaching slides: free tiers of online illustrators may be acceptable for unpublished teaching use, according to their terms.
Sources
- Inkscape license: https://www.inkscape.org/about/license/
- Affinity free access (Canva Help): https://www.canva.com/help/free-affinity-access/
- BioRender pricing: https://www.biorender.com/pricing
- BioRender licensing: https://help.biorender.com/hc/en-gb/articles/17605388551197-Licensing-and-usage-of-figures-made-in-BioRender
- Mind the Graph free use FAQ: https://mindthegraph.com/blog/faq/use-mind-the-graph-for-free/
- Servier Medical Art terms: https://smart.servier.com/terms-of-use/
- NIH BioArt terms: https://bioart.niaid.nih.gov/terms
- Bioicons: https://github.com/duerrsimon/bioicons
- SciDraw licensing: https://scidraw.io/licensing
- Adobe Illustrator pricing: https://www.adobe.com/products/illustrator/pricing-info.html
Frequently asked questions
- What is the best free software for scientific figures?
- For layout and illustration, Inkscape (open source, GPL) and Affinity (free with a Canva account since 2025) are the strongest free vector editors. For data plots, use matplotlib or ggplot2 and finish the layout in a vector editor.
- Can I publish figures made with free icon libraries?
- Usually yes, but it depends on each license. Servier Medical Art is CC BY 4.0 (credit required), NIH BioArt items are public domain or CC BY depending on the item, and Bioicons sets the license per icon. Always check the license shown next to the asset.
- Is BioRender's free plan enough for a paper?
- No. BioRender's own pricing page states that figures made on the free Basic plan cannot be used for publication or commercial use; a paid plan is required for publication rights.
- Should figures be vector or raster?
- Keep diagrams, plots and icons as vector (SVG, PDF or EPS) while editing, and only export raster (TIFF or PNG) at the resolution the journal requests, typically 300 dpi or higher for images.
- Do I need to cite the tools I used to make a figure?
- Cite or credit assets whose license requires it (for example CC BY icons). Software such as matplotlib or ggplot2 is commonly cited in methods sections, and many journals encourage this.
More guides on the Sciicons blog · Browse scientific illustrations · Free figure tools