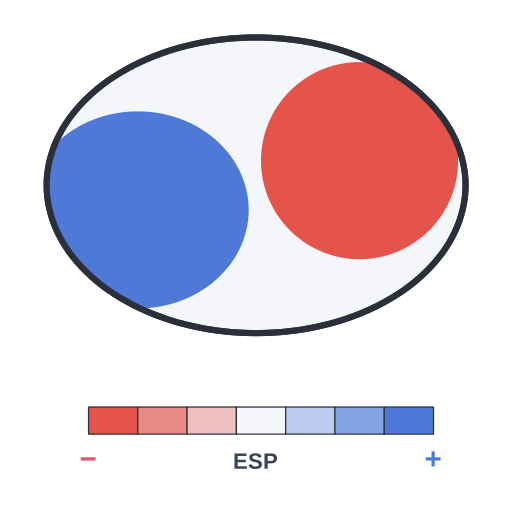
Electrostatic potential (ESP) map
♛ PRO Part of the Computational Chemistry: Methods & Simulation pack · 40 icons
- Every Pro pack, plus future ones
- Icon editor and recolour
- Molecules, Proteins, Gel Builder and Well Plate exports
- Use in papers, talks and commercial work
$49 one-time (₹2,999 in India) · lifetime access · no subscription
Pro keeps the free library free.
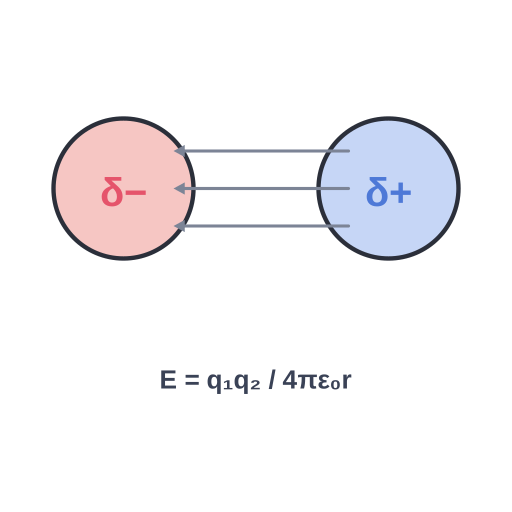
Electrostatic potential (ESP) map: negative regions in red and positive regions in blue on the molecular surface
Electrostatic potential (ESP) map illustration showing negative regions in red and positive regions in blue on the molecular surface. Use it in chemistry papers, graphical abstracts, posters and lecture slides about molecular simulation. Editable SVG from the Computational Chemistry: Methods & Simulation Pro pack, with grouped layers you can recolor.
Format: SVG (editable vector). License: Sciicons Pro license. Courtesy: Sciicons. Part of the Computational Chemistry: Methods & Simulation pack.
Keywords: Computational Chemistry: Methods & Simulation Pack, Sciicons Pro, esp, electrostatic potential, charge distribution, computational chemistry, molecular simulation, quantum chemistry
Related chemistry illustrations
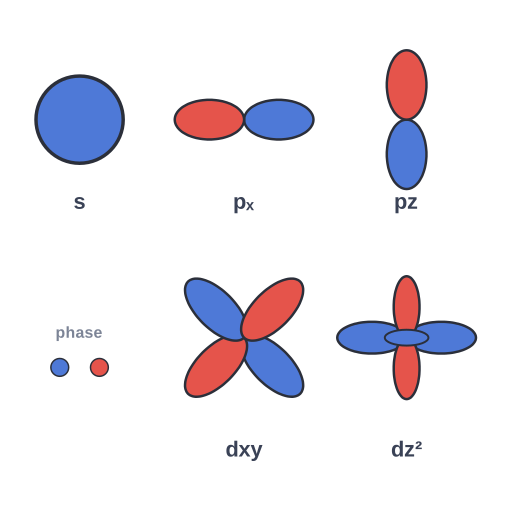 Atomic orbitals · Pro
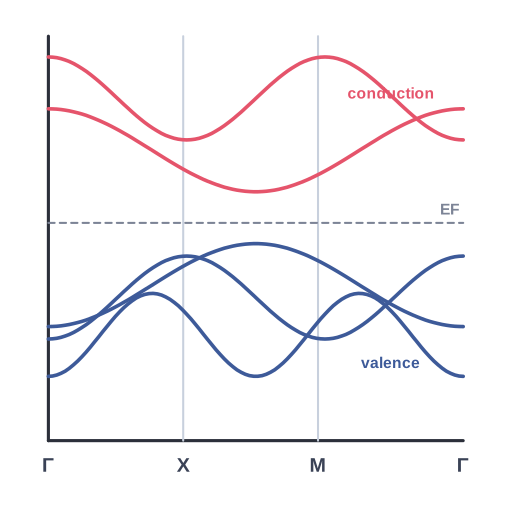 Electronic band structure along high-symmetry k-points with valence… · Pro
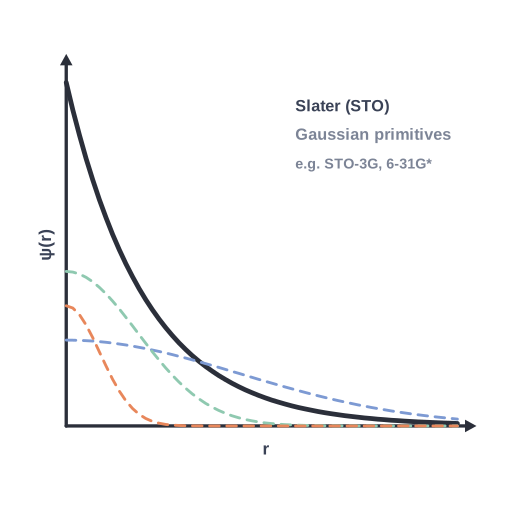 Basis sets · Pro
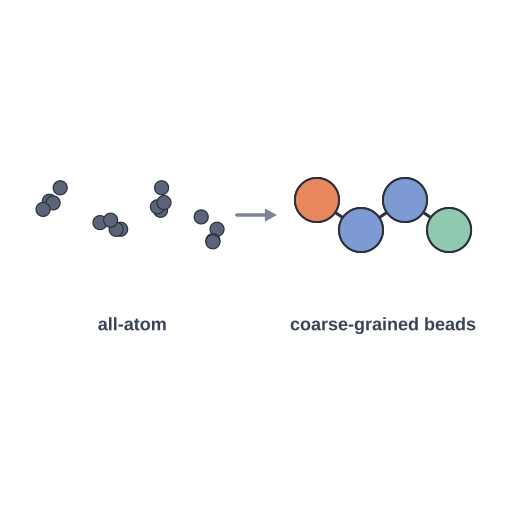 Coarse-grained model · Pro
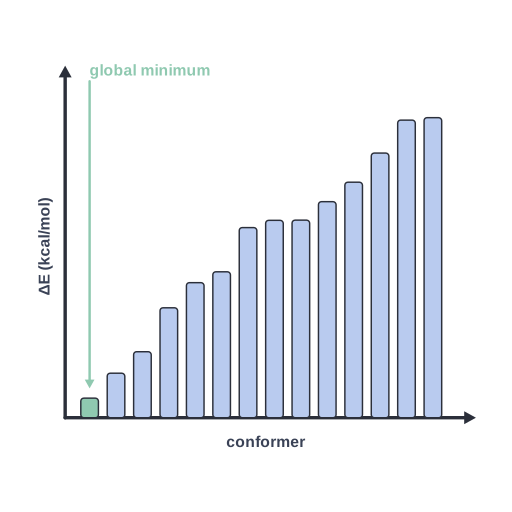 Conformer search · Pro
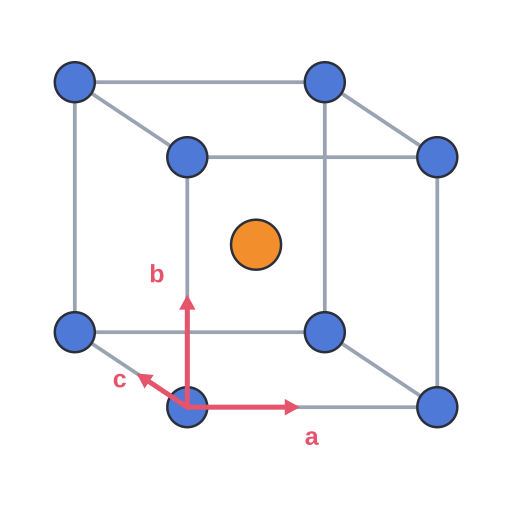 Crystal lattice · Pro
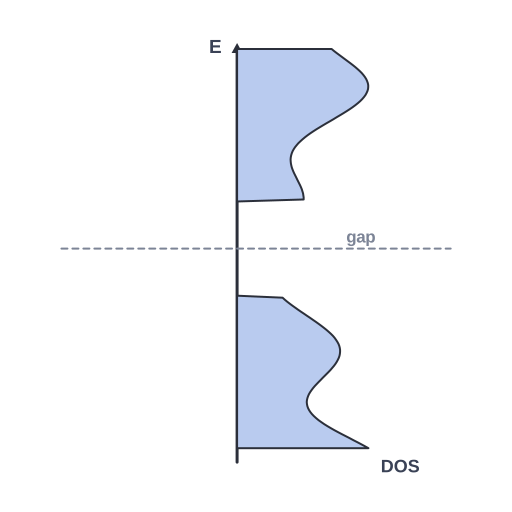 Density of states (DOS) versus energy, with the band gap around the… · Pro
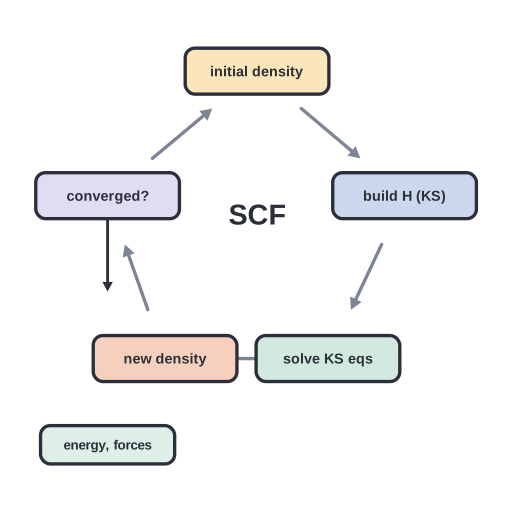 DFT self-consistent field workflow · Pro
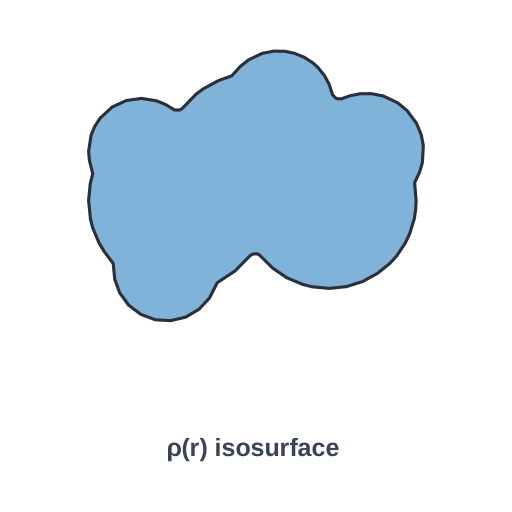 Electron density isosurface enclosing a small molecule · Pro
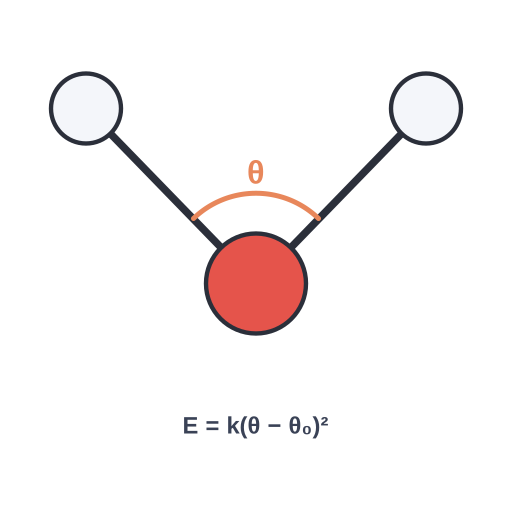 Force-field angle bending term around a central atom, E = k(θ − θ₀)² · Pro
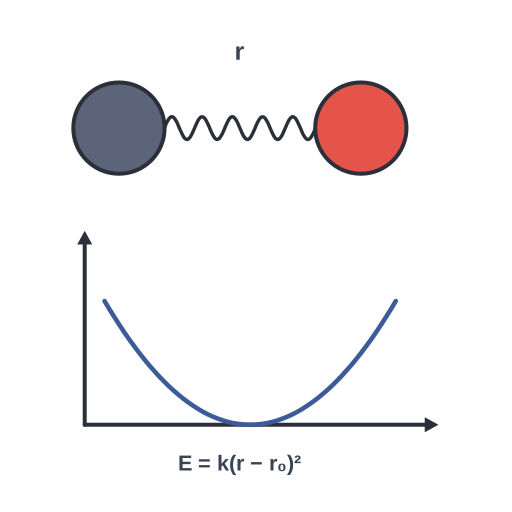 Force-field bond stretching term · Pro
 Electrostatic term · Pro