Principal component analysis
♛ PRO Part of the Machine Learning pack · 40 icons
- Every Pro pack, plus future ones
- Icon editor and recolour
- Molecules, Proteins, Gel Builder and Well Plate exports
- Use in papers, talks and commercial work
$49 one-time (₹2,999 in India) · lifetime access · no subscription
Pro keeps the free library free.
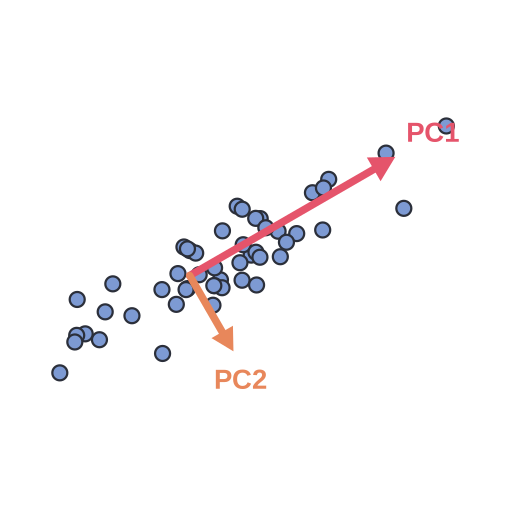
Principal component analysis: PC1 and PC2 point along the directions of greatest variance in the data
This illustration explains principal component analysis: PC1 and PC2 point along the directions of greatest variance in the data. Add it to machine learning diagrams, protocol figures, slides or lessons that involve pca. Available with Sciicons Pro in the Machine Learning pack as a layered, editable SVG.
Format: SVG (editable vector). License: Sciicons Pro license. Courtesy: Sciicons. Part of the Machine Learning pack.
Keywords: Machine Learning Pack, Sciicons Pro, pca, principal component analysis, principal components, variance, dimensionality reduction, machine learning, artificial intelligence, ai, deep learning, data science