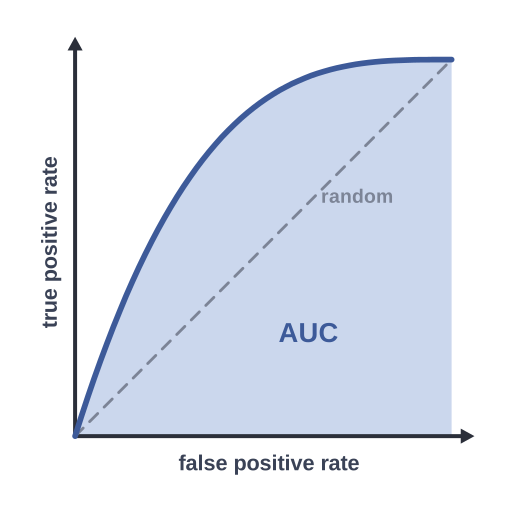
ROC curve
♛ PRO Part of the Machine Learning pack · 40 icons
- Every Pro pack, plus future ones
- Icon editor and recolour
- Molecules, Proteins, Gel Builder and Well Plate exports
- Use in papers, talks and commercial work
$49 one-time (₹2,999 in India) · lifetime access · no subscription
Pro keeps the free library free.
ROC curve: true positive rate against false positive rate, with the area under the curve (AUC)
This illustration explains ROC curve: true positive rate against false positive rate, with the area under the curve (AUC). Use it in machine learning papers, graphical abstracts, posters and lecture slides about classifier evaluation. Part of the Sciicons Machine Learning pack (Pro), delivered as an editable SVG with named layers.
Format: SVG (editable vector). License: Sciicons Pro license. Courtesy: Sciicons. Part of the Machine Learning pack.
Keywords: Machine Learning Pack, Sciicons Pro, roc curve, auc, true positive rate, false positive rate, classifier evaluation, machine learning, artificial intelligence, ai, deep learning, data science