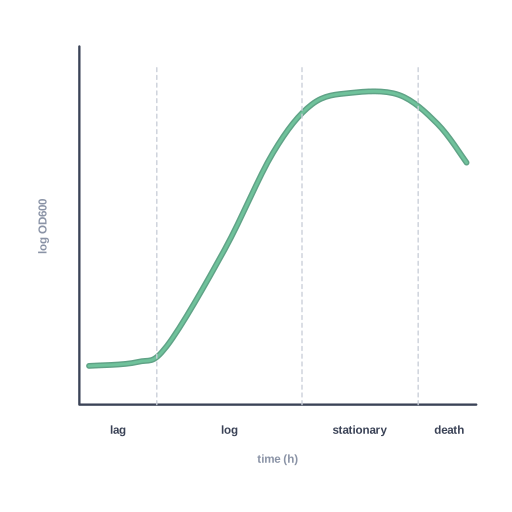
E. coli growth curve
♛ PRO Part of the E. coli pack · 26 icons
- Every Pro pack, plus future ones
- Icon editor and recolour
- Molecules, Proteins, Gel Builder and Well Plate exports
- Use in papers, talks and commercial work
$49 one-time (₹2,999 in India) · lifetime access · no subscription
Pro keeps the free library free.
E. coli growth curve: lag, exponential (log), stationary and death phases of log OD600 over time
This illustration explains E. coli growth curve: lag, exponential (log), stationary and death phases of log OD600 over time. It works well in microbiology figures, teaching materials and conference posters that explain escherichia coli. Part of the Sciicons E. coli pack (Pro), delivered as an editable SVG with named layers.
Format: SVG (editable vector). License: Sciicons Pro license. Courtesy: Sciicons. Part of the E. coli pack.
Keywords: E. coli Pack, Sciicons Pro, growth curve, log phase, OD600, e coli, e. coli, escherichia coli, escherichia, bacteria, bacterium, bacterial, microbial cell, microbe
Related microbiology illustrations
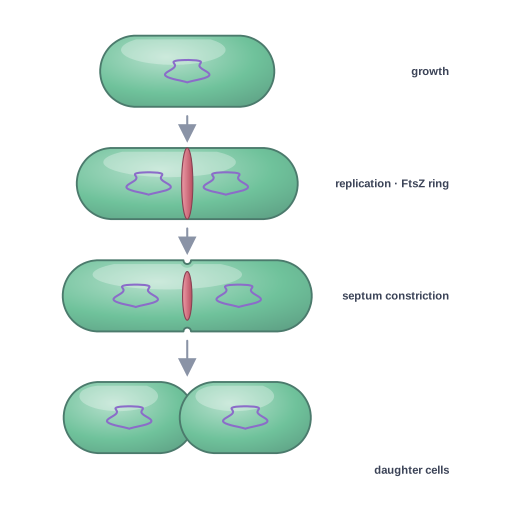 E. coli binary fission · Pro
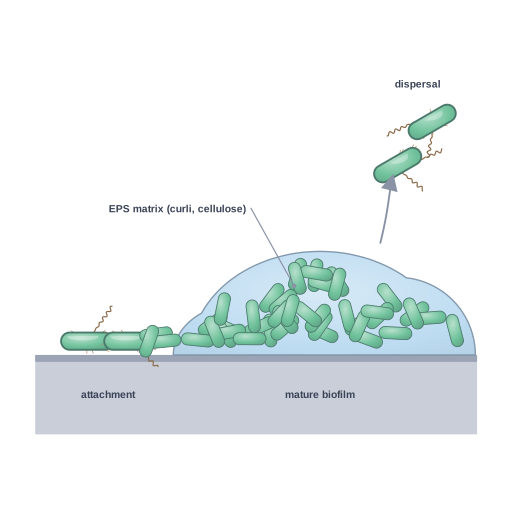 E. coli biofilm · Pro
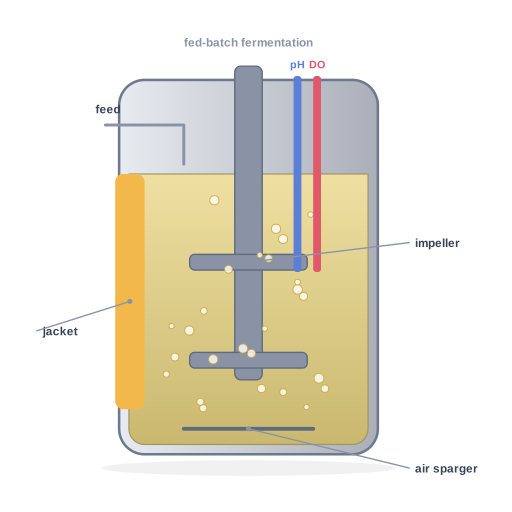 Stirred-tank bioreactor for E. coli fermentation with impeller,… · Pro
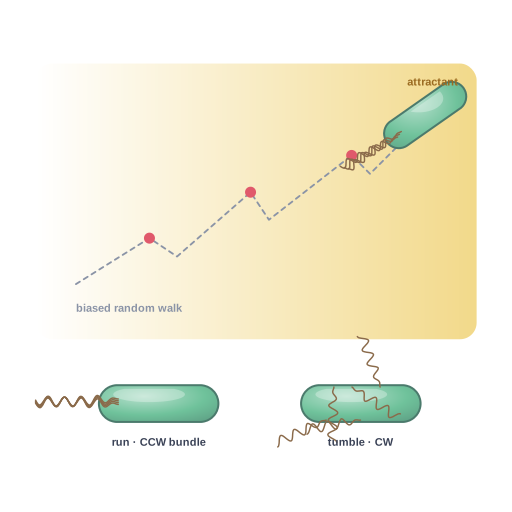 E. coli chemotaxis · Pro
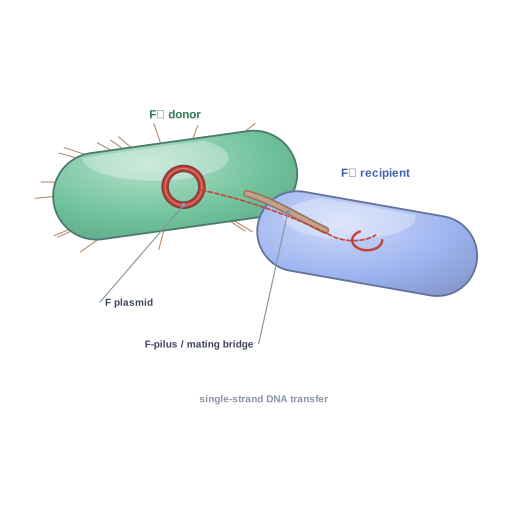 Bacterial conjugation in E. coli · Pro
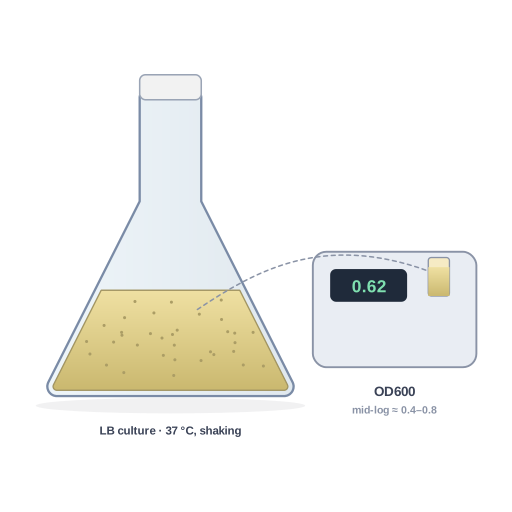 E. coli liquid culture in a baffled Erlenmeyer flask with OD600… · Pro
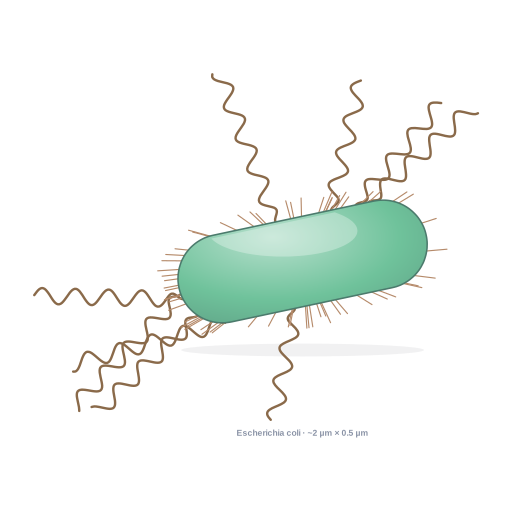 E. coli cell exterior · Pro
 Cluster of E. coli rods silhouette · Pro
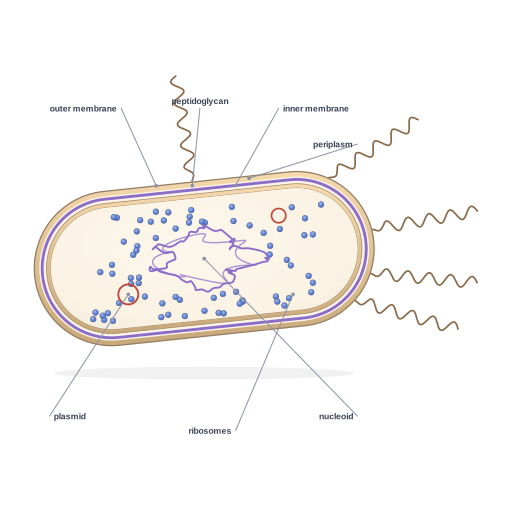 E. coli cutaway · Pro
 Dividing E. coli silhouette · Pro
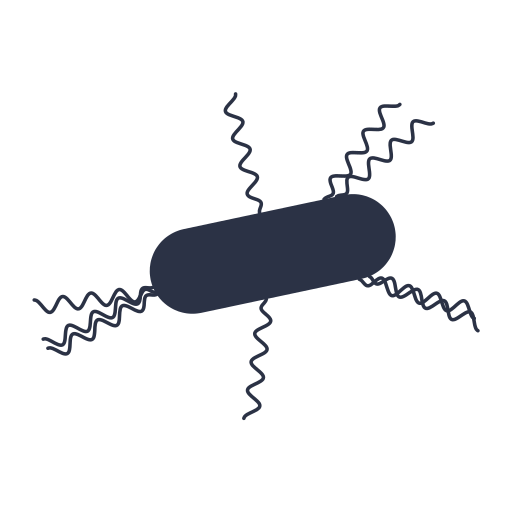 E. coli silhouette with peritrichous flagella · Pro
 SEM-style cluster of E. coli rods · Pro