qPCR melt curve analysis
♛ PRO Part of the Assays pack · 45 icons
- Every Pro pack, plus future ones
- Icon editor and recolour
- Molecules, Proteins, Gel Builder and Well Plate exports
- Use in papers, talks and commercial work
$49 one-time (₹2,999 in India) · lifetime access · no subscription
Pro keeps the free library free.
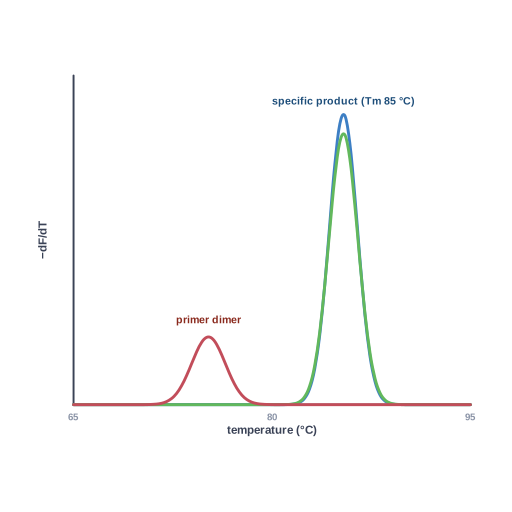
qPCR melt curve analysis: derivative −dF/dT vs temperature showing a single specific product peak and a primer-dimer peak, with raw melt fluorescence inset
qPCR melt curve analysis illustration showing derivative −dF/dT vs temperature showing a single specific product peak and a primer-dimer peak, with raw melt fluorescence inset. Handy for explaining melting curve in molecular biology presentations, theses, posters and course notes. Part of the Sciicons Assays pack (Pro), delivered as an editable SVG with named layers.
Format: SVG (editable vector). License: Sciicons Pro license. Courtesy: Sciicons. Part of the Assays pack.
Keywords: Assays Pack, Sciicons Pro, qPCR, melt curve, melting curve, Tm, SYBR green, assay, assays, lab assay, bioassay, assay, lab methods
Related molecular biology illustrations
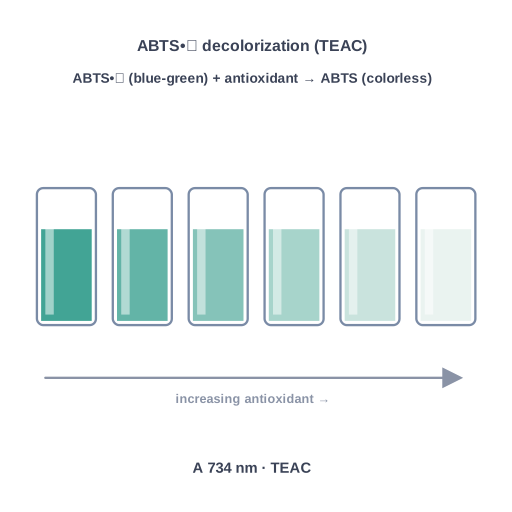 ABTS / TEAC assay · Pro
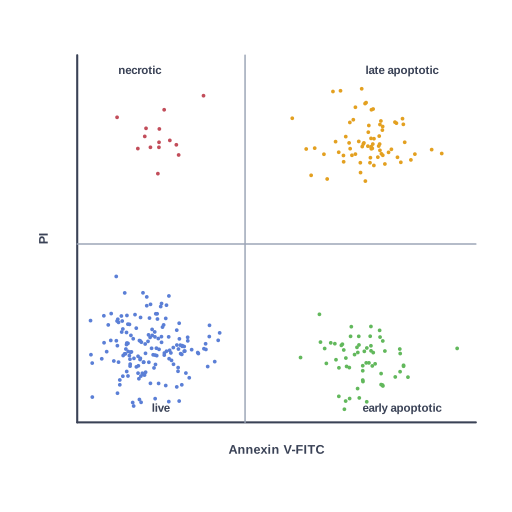 Annexin V / PI apoptosis assay · Pro
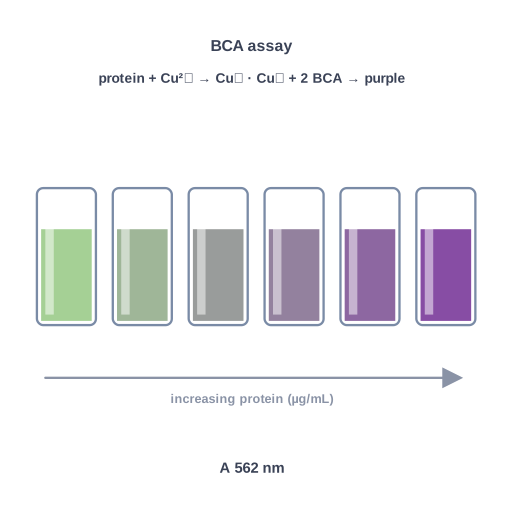 BCA protein assay · Pro
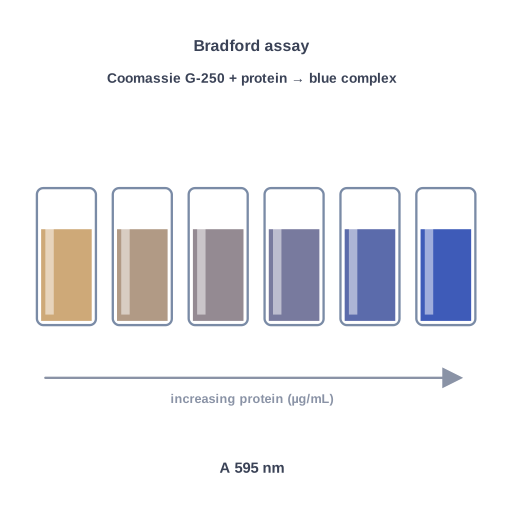 Bradford protein assay · Pro
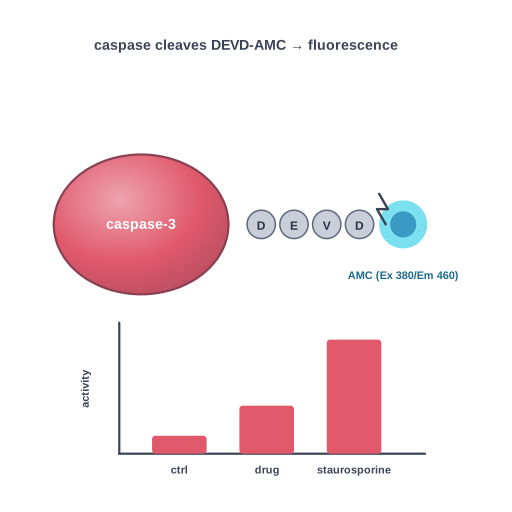 Caspase-3/7 activity assay · Pro
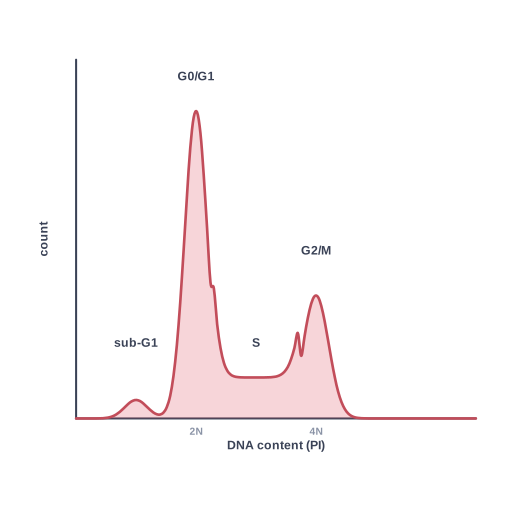 Cell cycle analysis by propidium iodide DNA content · Pro
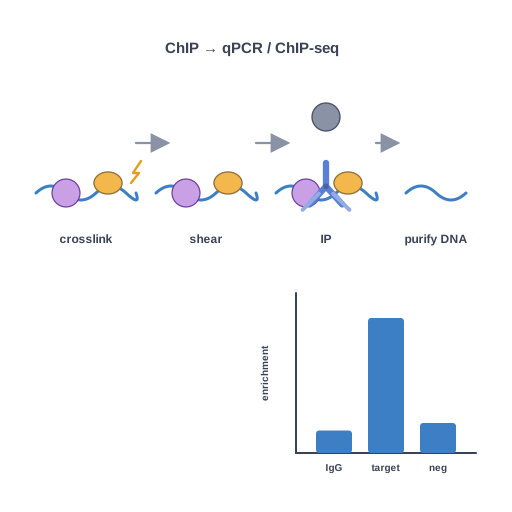 Chromatin immunoprecipitation (ChIP) · Pro
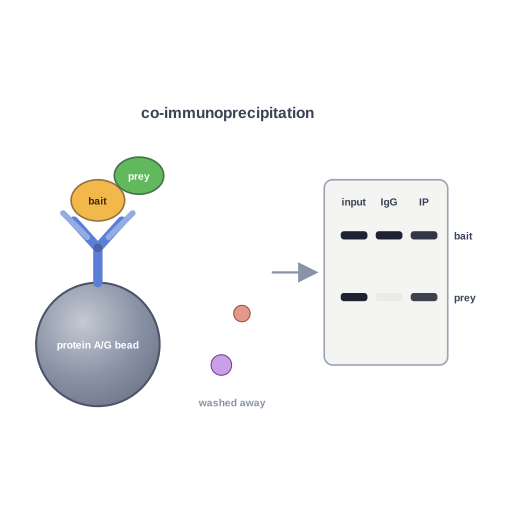 Immunoprecipitation (IP) and co-IP · Pro
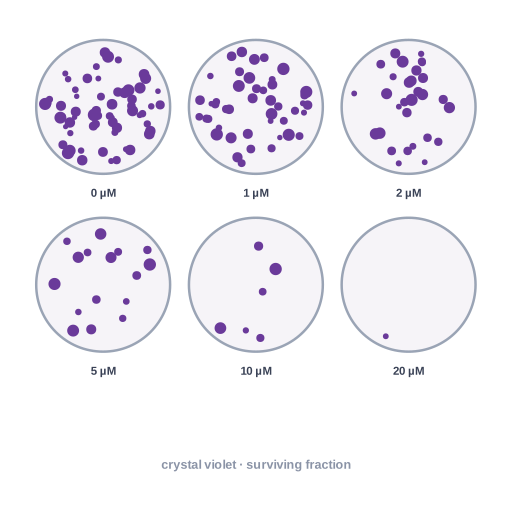 Clonogenic (colony formation) assay · Pro
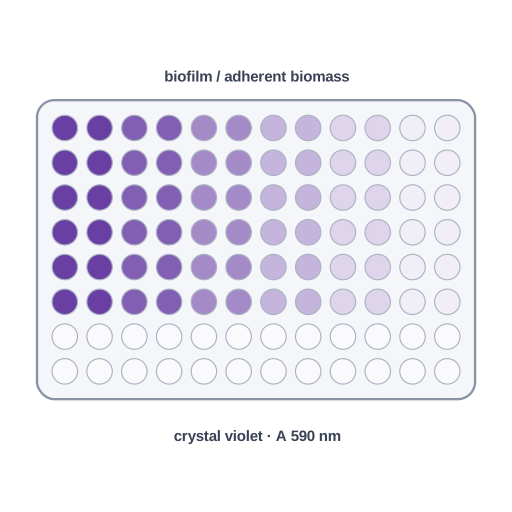 Crystal violet biofilm / cytotoxicity assay · Pro
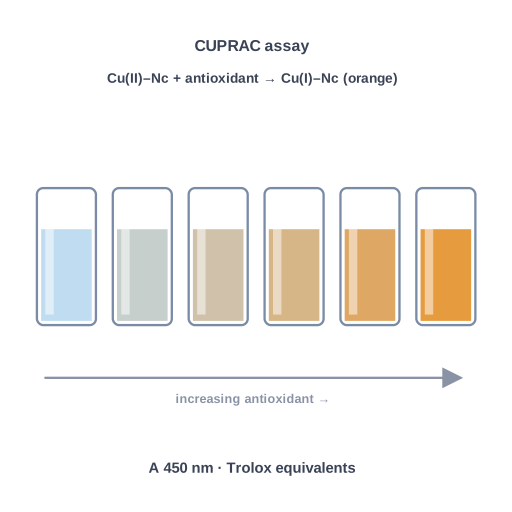 CUPRAC assay (cupric ion reducing antioxidant capacity) · Pro
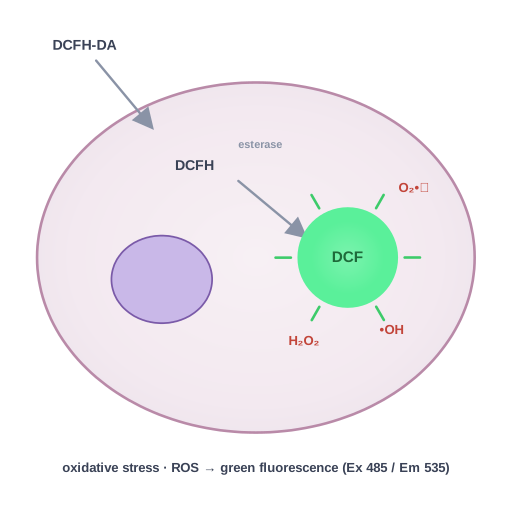 Oxidative stress ROS assay (DCFH-DA) · Pro